Locomotion tracking in Pigeons
Contents
Locomotion tracking in Pigeons
This is the code we used for the SfN 2022 Abstract submission on 3d tracking of freely moving pigeons reveals behavioral differences during space and color discrimination tasks.
Abstract:
Measuring behavior has become increasingly popular in neuroscience, and decisive advances in machine learning have enabled robust quantification of animal movement in ever less restrictive setups. Pigeons are a great example of a standard model in cognitive neuroscience whose natural behavior has been systematically restricted during cognitive tasks and thus remains under-investigated. We, therefore, propose a versatile approach to investigate cognition-guided behavior in minimally restricted conditions. Such an approach would increase ecological validity in neuroscience, and the quantification of behavior would provide a statistical control measure for animal movement within tasks. To this end, we built a multi-camera 3D tracking arena for cognitive testing in freely moving pigeons using markerless pose estimation and robust camera triangulation at high resolutions, for long recording periods of up to 80 minutes. With over 100 hours of video data, we show that 3D pose estimation with 6 cameras can reliably reconstruct the naturally upright pose of pigeons in a 4m2 field of view at a distance of up to 2.8m. For instance, the body size of individual pigeons can be accurately estimated through the additional z-axis (length: 303.12mm ± 14.06mm; height: 239.74mm ± 5.65mm), and head movements during locomotion and pecking reveal characteristic kinematic components in vertical and horizontal axes. Comparing different cognitive tasks for space and color discrimination on multiple touch screens, we show that pigeons exhibit different spatial navigation strategies between feeders, using distinct path traces and different preferred sections within the arena. Moreover, animals show individual differences in the overall symmetry of their use of space, as well as in average locomotion speed and total distance traveled. Further quantification of pigeons’ behavior on the tasks will be an important control to disentangle context- and task-associated neural activity in core brain structures.
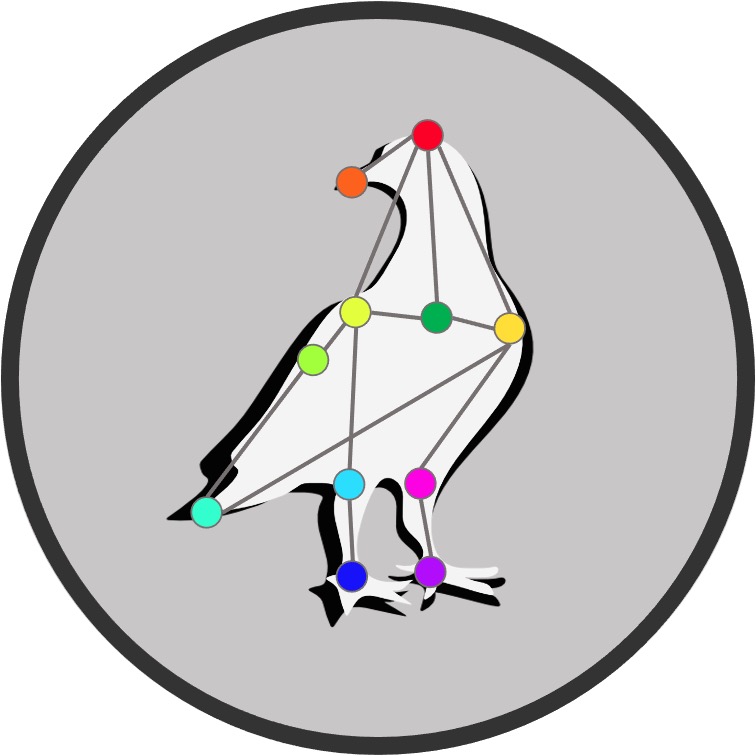
Download this notebook in the upper right corner as .ipynb file and install geopandas to follow along. We used 3D reconstructed pigeon poses using the PigeonSuperModel, DeepLabCut and Anipose:
Load 3D data from Anipose
Extract Arena Reference
Reduce Pigeon Pose
Analyze Kinematic Profiles
Resample data Resolution
Count Frames on Quadrant
Plot Spatial Distribution
# import libraries
import numpy as np
import pandas as pd
import geopandas as gpd
import matplotlib.pyplot as plt
from mpl_toolkits.axes_grid1 import make_axes_locatable
from shapely.ops import triangulate
from shapely.geometry import Polygon, Point, MultiPolygon, MultiPoint
Helper Functions
def fit_pointmap(grain, points):
    # create points with x and y coordinates
    pointmap = []
    shape = Polygon(points)

    # create a horizontal, equidistant line of point between with `grain` number of points
    for x in np.linspace(min(MultiPoint(points).bounds), max(MultiPoint(points).bounds), grain, dtype = float):

        # create a vertical, equidistant line of point between with `grain` number of points
        for y in np.linspace(min(MultiPoint(points).bounds), max(MultiPoint(points).bounds), grain, dtype = float):

            # within the double loop, define point with x and y coordinates
            p = Point(x,y)

            # filter points outside the original hexagon arena
            if shape.contains(p):
                pointmap.append(p)

    return pointmap

def fit_quadrants(map, step):
    # initialize quad_size
    quad_size = 0

    # initialize quadrants
    quadrants = [p.buffer(quad_size, cap_style=3) for p in map]

    while MultiPolygon(quadrants).is_valid:
        quad_size += step

        # create quadrant grid
        quadrants = [p.buffer(quad_size, cap_style=3) for p in map]

    return quad_size, quadrants
Load 3D datasets
# P175: last space autoshaping
filename_1 = r'/Users/guillermo/Sciebo/Workspace/HexArenaData/merged_20220309_HexagonalArena_P175.csv'
# P171: first space discrimination
filename_2 = r'/Users/guillermo/Sciebo/Workspace/HexArenaData/merged_20220310_HexagonalArena_P171.csv'
# P172: color discrimination
filename_3 = r'/Users/guillermo/Sciebo/Workspace/HexArenaData/merged_20220330_HexagonalArena_P172.csv'

df1 = pd.read_csv(filename_1)
df2 = pd.read_csv(filename_2)
df3 = pd.read_csv(filename_3)
Extract Reference Points for Arena Reconstruction
for df in [df1, df2, df3]:
    # extract coordinates as points
    cA = np.array((df.loc[0,df.columns.str.contains('cA_x')], df.loc[0,df.columns.str.contains('cA_y')], df.loc[0,df.columns.str.contains('cA_z')]))
    cB = np.array((df.loc[0,df.columns.str.contains('cB_x')], df.loc[0,df.columns.str.contains('cB_y')], df.loc[0,df.columns.str.contains('cB_z')]))
    cC = np.array((df.loc[0,df.columns.str.contains('cC_x')], df.loc[0,df.columns.str.contains('cC_y')], df.loc[0,df.columns.str.contains('cC_z')]))
    cD = np.array((df.loc[0,df.columns.str.contains('cD_x')], df.loc[0,df.columns.str.contains('cD_y')], df.loc[0,df.columns.str.contains('cD_z')]))
    cE = np.array((df.loc[0,df.columns.str.contains('cE_x')], df.loc[0,df.columns.str.contains('cE_y')], df.loc[0,df.columns.str.contains('cE_z')]))
    cF = np.array((df.loc[0,df.columns.str.contains('cF_x')], df.loc[0,df.columns.str.contains('cF_y')], df.loc[0,df.columns.str.contains('cF_z')]))
    hexagonpoints = [Point(cA), Point(cB), Point(cC), Point(cD), Point(cE), Point(cF)]

    # select grid parameters
    grain = 100 # this defines how many quadrants to fit
    step = 30 # this defines degree of overlapping between quadrants

    map = fit_pointmap(grain, hexagonpoints)
    quad_size, quadrants = fit_quadrants(map, step)

    corners = gpd.GeoSeries(hexagonpoints)
    pointgrid = gpd.GeoSeries(map)
    quadgrid = gpd.GeoSeries(quadrants)

    # Plot Arena Mapping
    fig, (ax1, ax2, ax3) = plt.subplots(1, 3, figsize=(30,10))
    corners.plot(ax=ax1,
            color = 'gray',
            markersize = 50,
            linewidth = 1,
            edgecolors = 'black',
            alpha = 1);

    pointgrid.plot(ax=ax2,
            color = 'gray',
            markersize = 5,
            linewidth = 1,
            edgecolors = 'black',
            alpha = 0.7);

    quadgrid.plot(ax = ax3,
            color = 'gray',
            linewidth = 0.3,
            edgecolors = 'black',
            alpha = 0.5);

    ax1.set_title('Original Coordinates');
    ax2.set_title(f'Fitted Pointmap with grain: {grain} and {len(quadgrid)} quadrants');
    ax3.set_title(f'Quadrant mapping with quadrants of {np.sqrt(quadrants[0].area):.2f} $mm$');
Reduce Pigeon Pose to Spine Centroid
timewindow = 5#  min
starttime = 20000 # frame
endtime = starttime + (timewindow*60*75)

pigeon1 = df1.loc[:, df1.columns.str.contains("UHS")]
pigeon1 = pigeon1.loc[starttime:endtime, pigeon1.columns.str.contains("x|y|z")]

pigeon2 = df2.loc[:, df2.columns.str.contains("UHS")]
pigeon2 = pigeon2.loc[starttime:endtime, pigeon2.columns.str.contains("x|y|z")]

pigeon3 = df3.loc[:, df3.columns.str.contains("UHS")]
pigeon3 = pigeon3.loc[starttime:endtime, pigeon3.columns.str.contains("x|y|z")]
Analyze Kinematic Profile to Separate Stops from Bouts
all_stops = []
all_max_total_movement = []

for pigeon in [pigeon1, pigeon2, pigeon3]:
    # calculate speed as displacement between subsequent frames
    x = pigeon[pigeon.columns[pigeon.columns.str.contains("x")]].values
    y = pigeon[pigeon.columns[pigeon.columns.str.contains("y")]].values
    u = np.diff(x, n=1, axis=0) * 75 # conversion Hz to sec
    v = np.diff(y, n=1, axis=0) * 75

    # calculate absolute speed
    #total_speed = abs(u)+abs(v)
    total_speed = np.sqrt(u**2+v**2)

    # realistic boundries, see plot below
    inactivity = 90
    outlier = 1500

    # find stops
    stops = np.copy(total_speed)
    stops[stops>inactivity] = np.nan

    # find movement
    max_total_movement = np.copy(total_speed)
    max_total_movement[total_speed<inactivity] = np.nan
    max_total_movement[total_speed>outlier] = np.nan

    # save data
    all_stops.append(stops)
    all_max_total_movement.append(max_total_movement)

    # plot Kinematics
    fig, (ax1, ax2, ax3, ax4) = plt.subplots(4, 1, figsize=(20,20))
    # plot 1
    ax1.set(title = 'Pigeon locomotion speed in x- and y-coordinates', xlabel='Time (frames @75Hz)', ylabel='Speed [mm/sec]');
    ax1.plot(u, label = 'x-coord')
    ax1.plot(v, label = 'y-coord')
    ax1.legend();

    # plot 2
    ax2.set(title = 'Pigeon locomotion speed in x- and y-coordinates', xlabel='Time (frames)', ylabel='Speed (mm / sec)');
    ax2.plot(total_speed, label = 'absolute speed in any coord')
    ax2.axhline(y=outlier, color= 'red', label = 'outlier threshold')
    ax2.legend()

    # plot 3
    ax3.set(title = 'Frequency of Pigeon locomotion speed between consecutive frames', xlabel='Speed (mm / sec)', ylabel='Absolute Frequency');
    ax3.hist(total_speed, bins = 1000, label = 'distribution speed');
    ax3.axvline(x=inactivity, color= 'black', label = 'inactivity threshold')
    ax3.axvline(x=outlier, color= 'red', label = 'outlier threshold')
    ax3.set_ylim(0,500)
    ax3.set_xlim(0, 2000)
    ax3.legend()

    # plot 4
    ax4.set(title = 'Pigeon locomotion speed in x- and y-coordinates', xlabel='Time (frames)', ylabel='Speed (mm / sec)');
    ax4.plot(max_total_movement, label = 'movement')
    ax4.plot(stops, label = 'inactivity')
    ax4.axhline(y=inactivity, color= 'black', label = 'inactivity threshold')
    ax4.axhline(y=outlier, color= 'red', label = 'outlier threshold')
    ax4.legend();

    fig.tight_layout()
    plt.show()
all_bout_events = []
for i in range(len(all_stops)):
    stop_events = [idx for idx in np.arange(len(all_stops[i])) if all_stops[i][idx]>0]
    print(f'Found {len(stop_events)} stop frames in {len(all_stops[i])} total frames [{100*len(stop_events)/len(all_stops[i]):.0f}%]')
    bout_events = [idx for idx in np.arange(len(all_max_total_movement[i])) if all_max_total_movement[i][idx]>0]
    print(f'Found {len(bout_events)} movement frames in {len(all_max_total_movement[i])} total frames [{100*len(bout_events)/len(all_max_total_movement[i]):.0f}%]')
    outliers = len(all_max_total_movement[i]) - (len(stop_events) + len(bout_events))
    print(f'Found {outliers} outlier frames in {len(all_max_total_movement[i])} total frames [{100*outliers/len(all_max_total_movement[i]):.3f}%]')
    all_bout_events.append(bout_events)
Found 4737 stop frames in 22500 total frames [21%]
Found 17746 movement frames in 22500 total frames [79%]
Found 17 outlier frames in 22500 total frames [0.076%]
Found 4940 stop frames in 22500 total frames [22%]
Found 17560 movement frames in 22500 total frames [78%]
Found 0 outlier frames in 22500 total frames [0.000%]
Found 3438 stop frames in 22500 total frames [15%]
Found 18881 movement frames in 22500 total frames [84%]
Found 181 outlier frames in 22500 total frames [0.804%]
Resample Data resolution
all_res_pigeon_bouts = []
for pigeon in [pigeon1, pigeon2, pigeon3]:
    # subset stops
    pigeon_stops = pigeon.iloc[stop_events]
    pigeon_bouts = pigeon.iloc[bout_events]

    # resample stops
    fps = 75
    res_fps = 30
    length = len(pigeon_stops)
    res_length = length/fps*res_fps
    chunks = int(length/(length/res_length))
    res_index = np.linspace(0, length-1, num=chunks)
    res_pigeon_stops = pigeon_stops.iloc[res_index].reset_index(drop=True)

    # resample bouts
    length = len(pigeon_bouts)
    res_length = length/fps*res_fps
    chunks = int(length/(length/res_length))
    res_index = np.linspace(0, length-1, num=chunks)
    res_pigeon_bouts = pigeon_bouts.iloc[res_index].reset_index(drop=True)
    all_res_pigeon_bouts.append(res_pigeon_bouts)


res_pigeon_bouts1 = all_res_pigeon_bouts[0]
res_pigeon_bouts2 = all_res_pigeon_bouts[1]
res_pigeon_bouts3 = all_res_pigeon_bouts[2]
Count Frames on Quadrant for Spatial Distribution
# calculate pigeon path

# Find point in polygon
visits1 = []
visits2 = []
visits3 = []

## P1
# get coordinates in every time frame
for t in range(len(res_pigeon_bouts1)):
    p = Point(res_pigeon_bouts1.iloc[t,:])
    # assign quadrant that contains pigeon location
    boollist = quadgrid.contains(p)
    [visits1.append(i) for i, x in enumerate(boollist) if x]

# count visit per quadrant index
counts = pd.Series(visits1).groupby(visits1).size().reindex(quadgrid.index, fill_value=0)

# create GeoPandas Data Frame
boutcount1 = gpd.GeoDataFrame(pd.concat([counts, quadgrid], axis=1))
boutcount1.columns = ["visits", "geometry"]

## P2
# get coordinates in every time frame
for t in range(len(res_pigeon_bouts2)):
    p = Point(res_pigeon_bouts2.iloc[t,:])
    # assign quadrant that contains pigeon location
    boollist = quadgrid.contains(p)
    [visits2.append(i) for i, x in enumerate(boollist) if x]

# count visit per quadrant index
counts = pd.Series(visits2).groupby(visits2).size().reindex(quadgrid.index, fill_value=0)

# create GeoPandas Data Frame
boutcount2 = gpd.GeoDataFrame(pd.concat([counts, quadgrid], axis=1))
boutcount2.columns = ["visits", "geometry"]

## P3
# get coordinates in every time frame
for t in range(len(res_pigeon_bouts3)):
    p = Point(res_pigeon_bouts3.iloc[t,:])
    # assign quadrant that contains pigeon location
    boollist = quadgrid.contains(p)
    [visits3.append(i) for i, x in enumerate(boollist) if x]

# count visit per quadrant index
counts = pd.Series(visits3).groupby(visits3).size().reindex(quadgrid.index, fill_value=0)

# create GeoPandas Data Frame
boutcount3 = gpd.GeoDataFrame(pd.concat([counts, quadgrid], axis=1))
boutcount3.columns = ["visits", "geometry"]
Plot Figures of Spatial Distribution
plt.rcParams.update({'font.size':25})

# Plot Pigeon Locomotion
fig, (ax1, ax2, ax3) = plt.subplots(1, 3, figsize=(30,8))

# plot 1
divider1 = make_axes_locatable(ax1)
cax1 = divider1.append_axes("right", size="5%", pad=0.1)
boutcount1.plot(column='visits',
        ax = ax1,
        linewidth=1,
        cmap='jet',
        alpha = 0.9, legend=True, cax=cax1);

# plot 2
divider2 = make_axes_locatable(ax2)
cax2 = divider2.append_axes("right", size="5%", pad=0.1)
boutcount2.plot(column='visits',
        ax = ax2,
        linewidth=1,
        cmap='jet',
        alpha = 0.9, legend=True, cax=cax2);

# plot 3
divider3 = make_axes_locatable(ax3)
cax3 = divider3.append_axes("right", size="5%", pad=0.1)
boutcount3.plot(column='visits',
        ax = ax3,
        linewidth=1,
        cmap='jet',
        alpha = 0.9, legend=True, cax=cax3);

fig.suptitle("Spatial Frequency of Pigeon Locomotion in a 5min Time Window ")
ax1.set(title = 'Pigeon P175 session 20220309', xlabel='x-coordinate [mm]', ylabel='y-coordinate [mm]');
ax2.set(title = 'Pigeon P171 session 20220310', xlabel='x-coordinate [mm]', ylabel='y-coordinate [mm]');
ax3.set(title = 'Pigeon P172 session 20220330', xlabel='x-coordinate [mm]', ylabel='y-coordinate [mm]');

cax1.set_ylabel(f'Frame count @{res_fps}Hz ');
cax2.set_ylabel(f'Frame count @{res_fps}Hz ');
cax3.set_ylabel(f'Frame count @{res_fps}Hz ');

plt.tight_layout()
# reset
plt.rcdefaults()